The latest foray our house has made into thing that are (unnecessarily) connected to the internet, also known as the Internet of Things, is the Honeywell Total Connect Comfort.
It’s controls your central heating with electronic valves on each radiator, which each talk wirelessly to a base unit. Each valve has a thermometer, which means that every room can be set to a different temperature, and the system can be smart and learn how fast each room warms up.
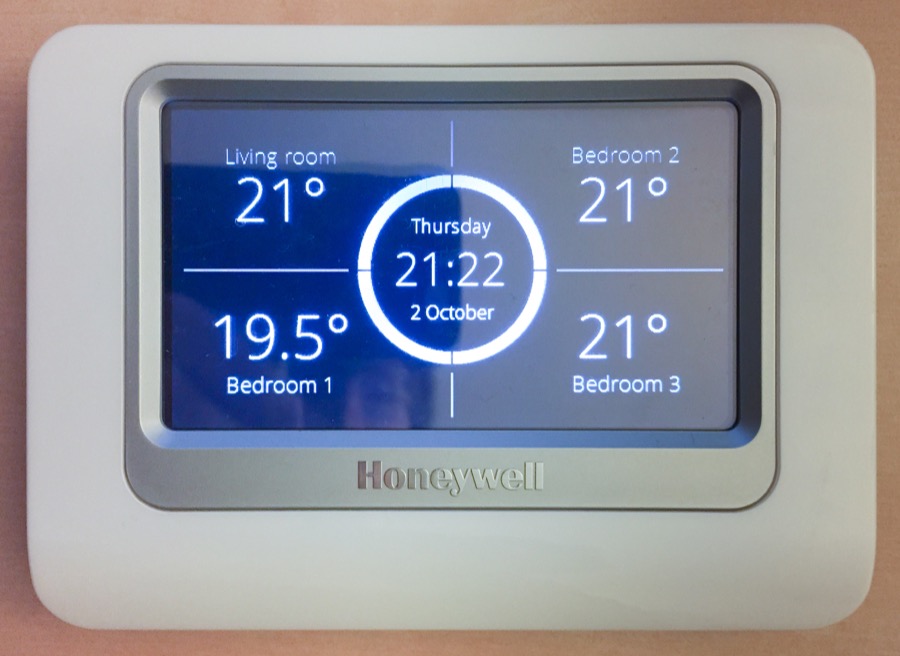
The intelligent per-room monitoring is the useful part of the system, and the part that will actually save you money. As it is with the Internet of Things though, if it can have an iPhone app… well, let’s just say you can change the temperature of your bathroom while sitting on a beach if your book isn’t holding your attention.
Home automation like this has an interesting future. Apple is getting big on it with HomeKit in every iPhone, which at some point will presumably allow you to voice control your heating through Siri. It does bring interesting questions about longevity though. How old are the standard non-Internet connected valves on your radiators? And what do you think the lifespan of the Honeywell system is? Even if it lasts past a decade, will the servers that allow iPhone control be around then? Will we even have iPhones?

Thoughts on the future of home automation aside, one aspect I find sorely lacking is any kind of logging or historical view. The thought of all that data going to waste while I am in a position to do something about it is nigh unbearable. Who doesn’t want to see the temperature in their house over the last year (or five)?
With slightly apprehensive thoughts of taking a soldering iron to the base unit, I took a look at how the iPhone app works. Thankfully it uses a nice JSON API to talk to Honeywell’s servers, which makes getting at the data a whole lot easier. There’s a slight latency in the API that makes me think it’s actually just proxying a connection to the hub in your house. Though I have no evidence to back me up, I think this is pretty likely. It makes the servers dirt cheap to run (and customers will expect them to run indefinitely), and partly explain why there’s no historical data.
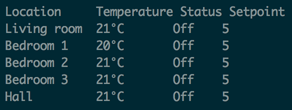
Given a nice API to talk to, I wrote a Perl wrapper to get temperatures from it. Once in posession of the data, the next part is graphing it. I used Cacti for this and I’ve included a script that outputs in a Cacti-readable format, along with several templates. Download the code!
As Cacti isn’t very beginner-friendly, I’ve written a setup guide that should end up getting you some awesome graphs like these:
